Ardent Performance Computing
Latest Post
Postgres recovery_prefetch Considered Harmful and Causing Outages
Another story of something I saw in the field which surprised me. Turns out recovery_prefetch can cause outages.
Something which has been happening quietly in the background all the time, but we didn’t notice until we looked close enough to see it.
After a lot of work I discovered this was partly a case where someone had dropped an email to the postgres hackers list years ago “hey what about this” and everyone thought “nah it can’t be that bad” … and now here we are seeing production outages!
Exhibit A: Feb 2021, while the feature was being developed, a year and a half before it shipped, Stephen Frost
- Issuing unnecessary prefetches for blocks we’ve already sent a prefetch for is arguably a concern even if FPWs are off but the benefit of doing the prefetching almost certainly will outweight that and mean that finding a way to address it is something we could certainly do later as a future improvement. I wouldn’t have any issue with that. Just doesn’t seem as clear-cut to me when thinking about the FPW-enabled case. Ultimately, if you, Andres and Munro are all not concerned about it and no one else speaks up then I’m not going to pitch a fuss over it being committed, but, as you said above, it seemed like a good point to raise for everyone to consider.
https://www.postgresql.org/message-id/20210214231815.GO27507@tamriel.snowman.net
Exhibit B: Mar 2025, clear report from the field, Michael Zhilin (Postgres Pro)
- One customer complained that physical standby has significant replay lag (few hours) on modern powerful bare metal servers. According to output of “top”, startup process and few kernel workers utilized CPU, mostly in kernel space. The incident has been resolved by disabling recovery_prefetch after quick analysis of perf and strace outputs. Actual XLog prefetching code doesn’t consider that shared buffer may be loaded from WAL FPI rather than from disk and makes fadvise calls in such cases.
https://www.postgresql.org/message-id/9bdb428a-fc8e-4801-8fff-1ad0bc6fa76b%40postgrespro.ru
Both of these emails were on the right track, but didn’t quite get the complete picture yet.
First: FPI/FPW is ubiquitous today. While it’s very expensive in terms of performance, it’s the only way Postgres has of protecting from torn writes on OS restarts. As a result, the majority of production Postgres installations today (community oss version) enable this.
Second: synchronous replication is becoming more common. There are really only two ways to completely protect community open source postgres against data loss on hardware failures: (1) storage layer replication with oss tech like DRBD or expensive proprietary storage & clustering technology or (2) database layer protection with postgres synchronous replication. The second option is the normal solution with kubernetes and commodity hardware.
Third: something that hasn’t previously been diagnosed/reported – the problem with recovery_prefetch isn’t just about FPIs, it’s also about the fact that when the primary instance does large sequential I/O, recovery_prefetch converts those operations into 8k random reads. For the same number of bytes read, this amplifies IOPS as much as 16x on replicas. This can easily exhaust available IOPS, causing replicas to significantly lag after write activity.
The read IOPS amplification combined with Postgres design for synchronous replication is what turns recovery_prefetch into an actual outage-inducing killer. And it turns out this is trivial to reproduce once you know the steps.
- Start up postgres with synchronous replication to a standby, on small servers with inexpensive hard drives (for example: cloud disk with 500 IOPS, 2 CPUs, 8GB memory)
- Initialize pgbench scale 640 for about 10GB data
- Disable autovac on pgbench_accounts just so it doesn’t interfere with the experiment.
- Run pgbench at 5 TPS fixed in a terminal you can watch.
- Update 5% of the table. (Checkpoint and update pgbench_accounts where aid%20 = 0.) This generates a burst of write activity. Pgbench will slow down until it finishes. Wait for this to complete.
- Kill the walreceiver process to emulate network/system hang or instability that disrupts this connection.
- TPS drops to zero and all writes hang for over 30 minutes (can be hours with larger pgbench table).
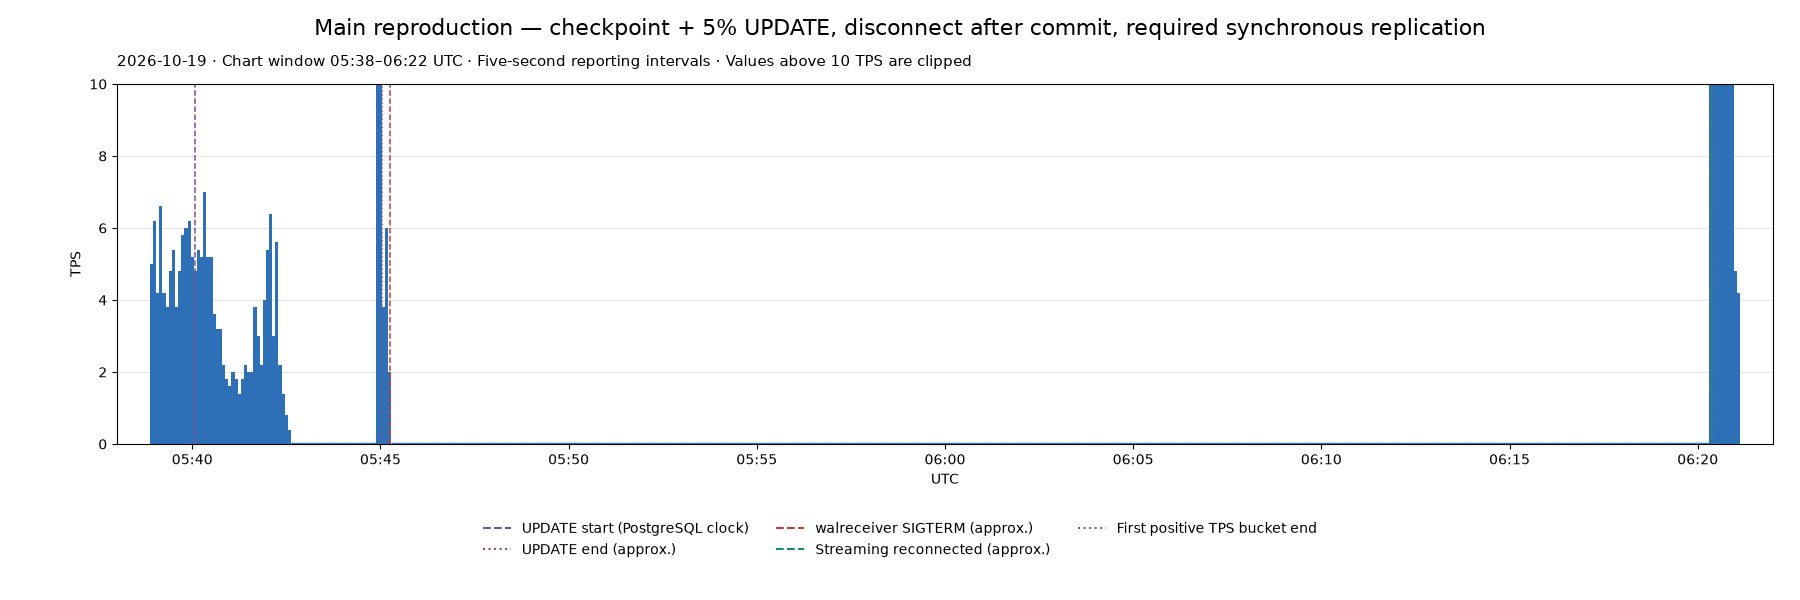
It really is this easy to consistently reproduce this outage. https://github.com/ardentperf-labs/walreceiver-outage-repro
And for what it’s worth, VACUUM itself is quite capable of producing write activity too. The recipe for an outage is simply “enough bad luck”: a network glitch that interrupts streaming replication at the same time as a burst of write activity.
To understand why the whole system hangs, it really comes down to two simple things: (1) synchronous replication and (2) the core “state machine” that defines a Postgres Standby Server.
Continue readingSubscribe

Disclaimer
This is my personal website. The views expressed here are mine alone and may not reflect the views of my employer.
contact: schneider @ ardentperf.com






Recent Comments